The intensity of residential segregation in New York City today

Sept. 11, 2014 — It’s impossible to spend a day in New York City without hearing a dozen times how “diverse” the city is.

That’s true on an overall level, but strikingly untrue on a block-by-block level. New York City remains one of the most residentially segregated cities in the country.

What tools would you like to see?

We’re ready to develop an extensive collection of demographic and mapping tools. What tools would be useful to you? Tell us

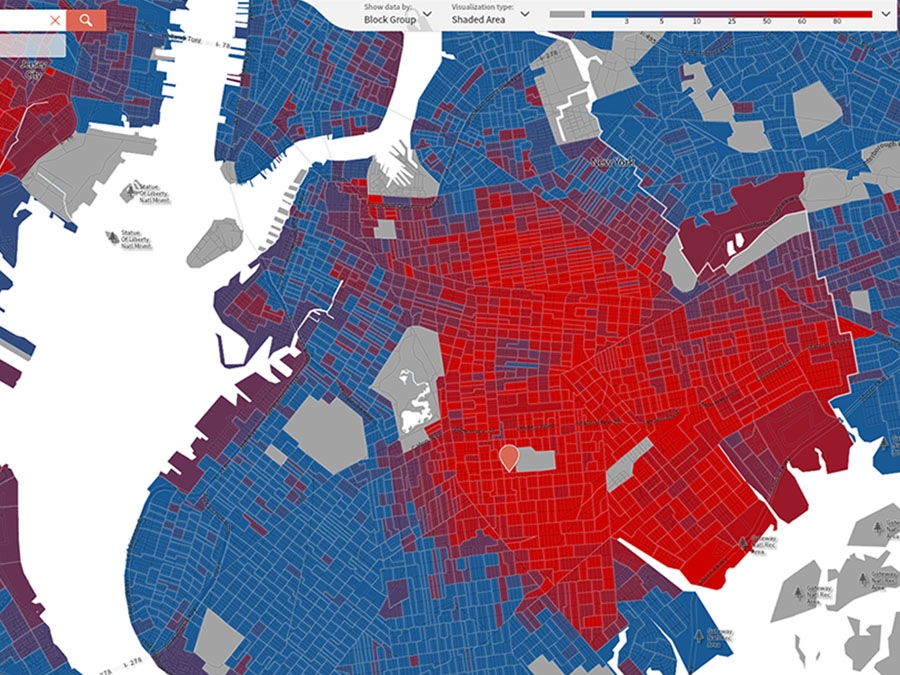
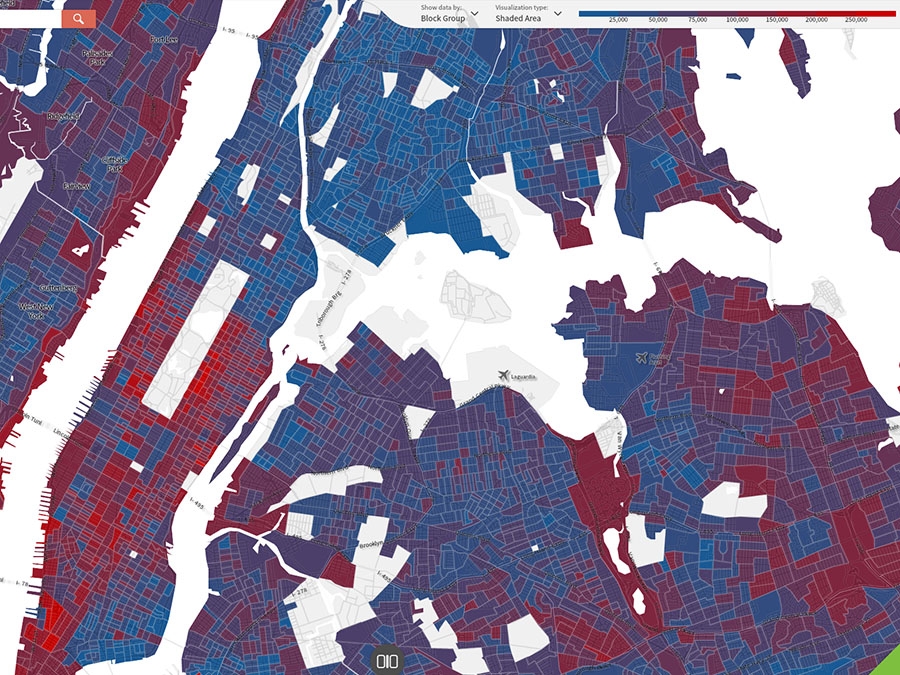
This mapping, based on 5-year American Community Survey Data (2008 - 2012), provides vivid evidence.

In the upper righthand corner of each of the maps, a key shows eight percentage bands for the studied group.

Data is shown on the Census block group level — larger than a Census block, smaller than a Census tract.

Note that the boldest blue means that the racial or ethnic group in question represents only 3.0 or less of the Census block group. Hitting the pause button allows you to advance through the slideshow manually (using the arrows) at your own speed.

Maps generated using the wonderful tools made available to us by our colleagues at Social Explorer.

African Americans in Brooklyn: Flatbush Avenue remains the best guide to the Borough’s demographic split (that’s where the vivid or ultra-vivid red — either more than 60 ot 80 percent African-American — tends to end and where you are not far from under 5 percent (or even less) African-American. Note that the southernmost part of Brooklyn (mostly highly white) is not depicted).

Latinos in the Bronx: The intense concentration of Latinos in the Bronx…except in Riverdale and the northeast portion of the borough.

Whites in Staten Island: Interestingly, the City Council district that encompasses the northern third of Staten Island is the most diverse in the city. But most of the rest of Staten Island has remained ultra-white. The maintenance of that pattern was facilitated by a rezoning of land during the Bloomberg years to preclude the construction of multi-family housing in the southern two-thirds of the borough. Note: the southernmost portion of Staten Island, also very white, is not depicted.

Asians in Queens: Significant portions of Queens are dominated by Asian residents. For the most part, however, the intensity of this segregation is not as great as that of other groups in other boroughs.

Who lives where in Manhattan? In this map, a little surprise. Rather than providing racial or ethnic information, we depict median household income (same ACS 2008-2012 survey; income represented in 2012, inflation-adjusted dollars). Manhattan (with the northern and southern tips cut off) is depicted in the leftmost third of the map. The bolder the red, the higher the median income. You guess who lives where.